Design Challenge Ancestry Composition is a powerful, well-tested system for analyzing your ancestry based on your DNA. We do this by comparing the DNA you have to the DNA in our reference dataset of over 20 populations, and assigning the DNA to the population whose DNA it’s most similar to. Prior to this feature, 23andMe provided a very basic ancestry analysis tool, known as Ancestry Painting (shown to the right). This feature displayed a person’s ancestry breakdown via segments on each chromosome. While the chromosome view is very intuitive (and an accurate depiction) for geneticists, everyday folks were confused by the extra detail it provided. My goal was to design something iconic and shareable, and would celebrate the diversity of everyone’s ancestry in a personalized way.
Communicating Ancestry
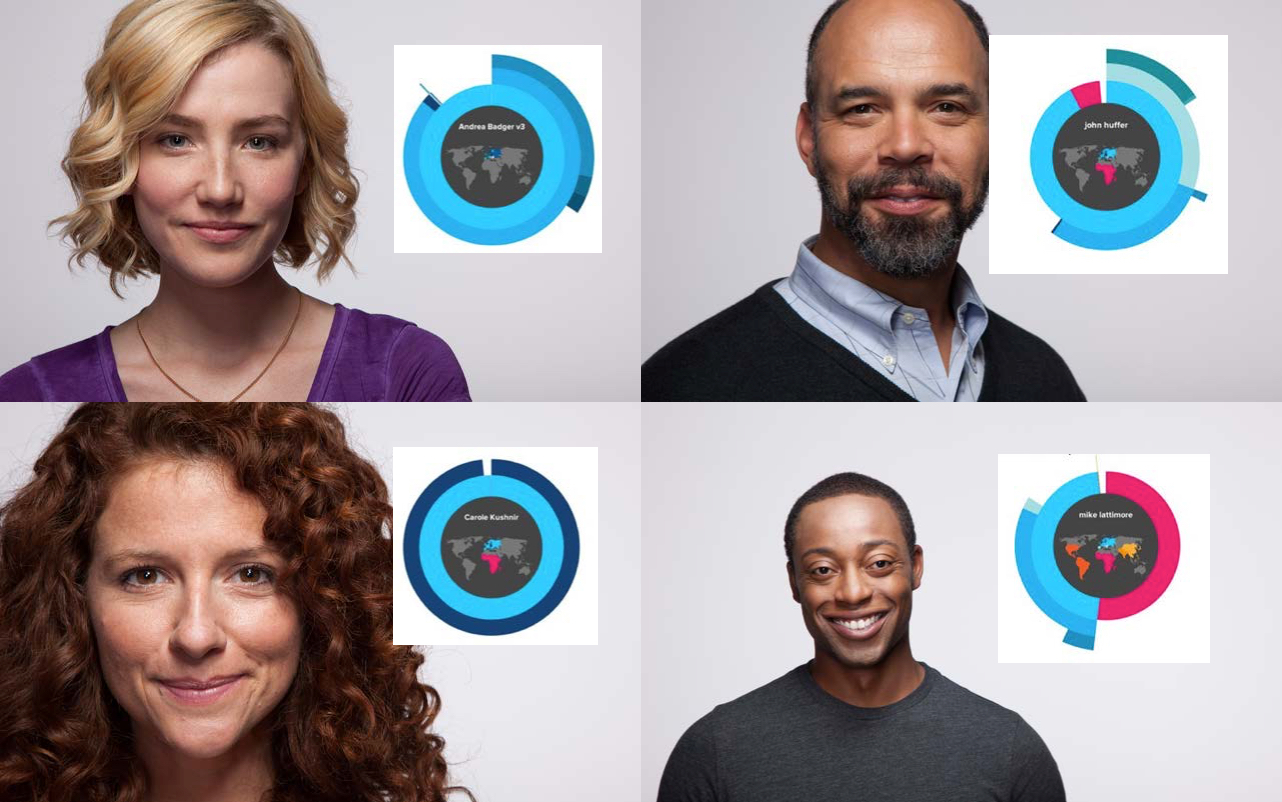
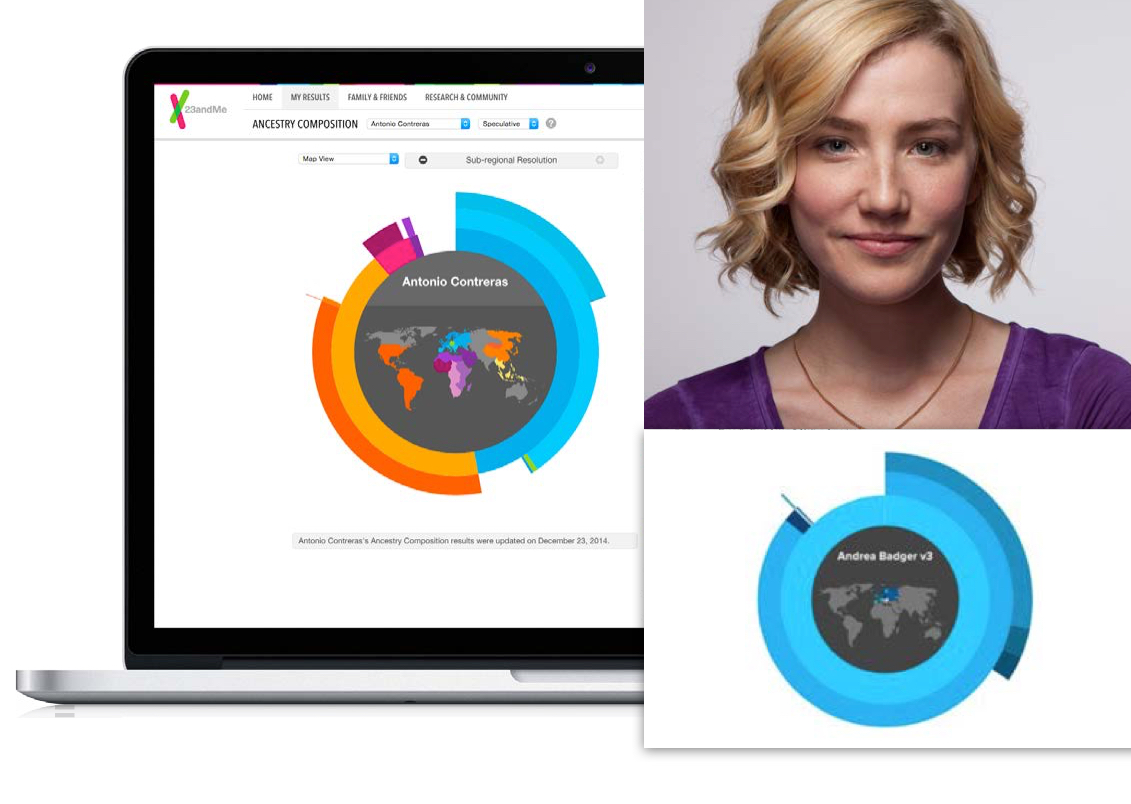
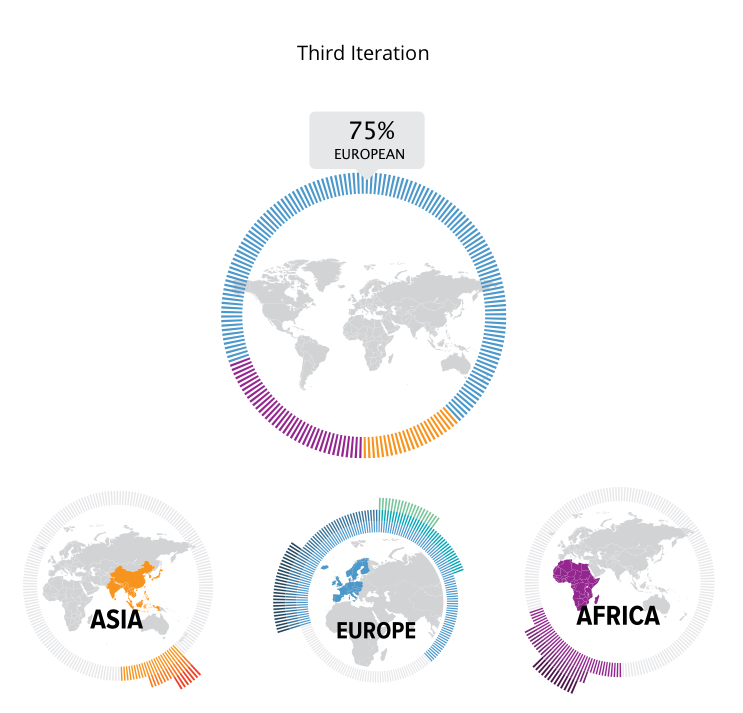
I knew having one dominant shape that could summarize one’s ancestries would be a great way to simplify the visual design of this feature. People are familiar with pie charts and a circle is a great shape to represent a single entity.
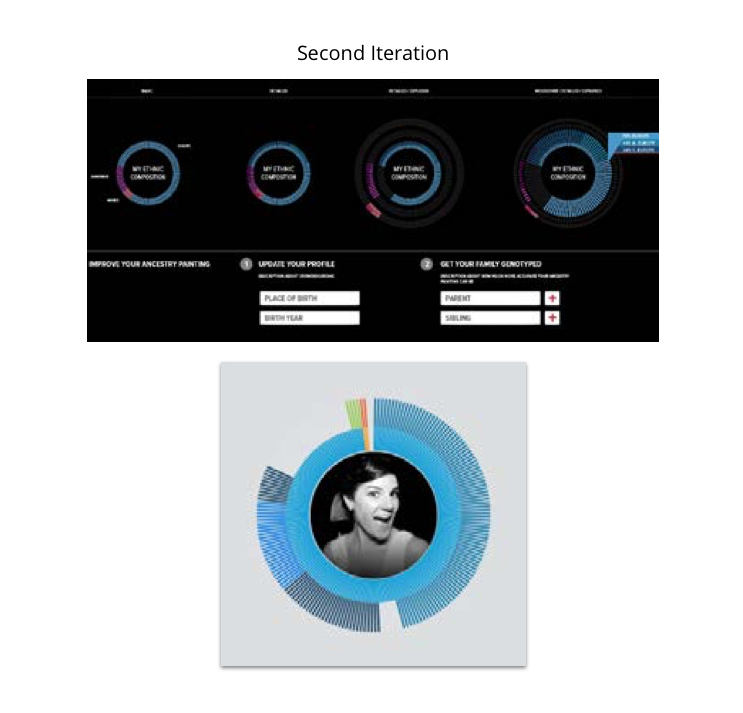
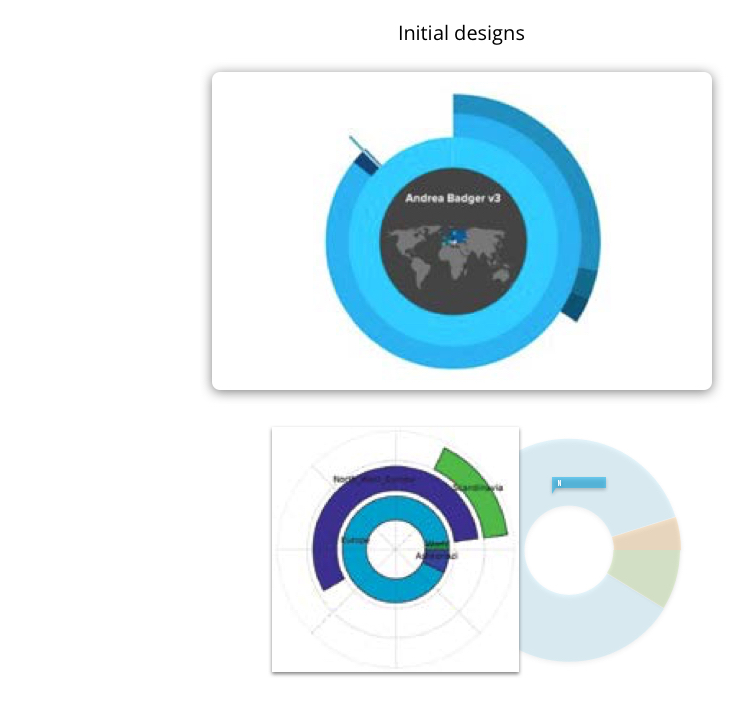
With a circle established as my container, I looked for ways to communicate populations from global levels down to sub-regional levels. A tiered ring chart was perfect for this. The inner ring would represent the ancestry breakdown at the global level, the middle ring would represent the regional level, and the outer ring would represent the sub-regional level. When all the rings are shown, the visualized ring chart would be as unique as their own “snow flake”.
Wireframes
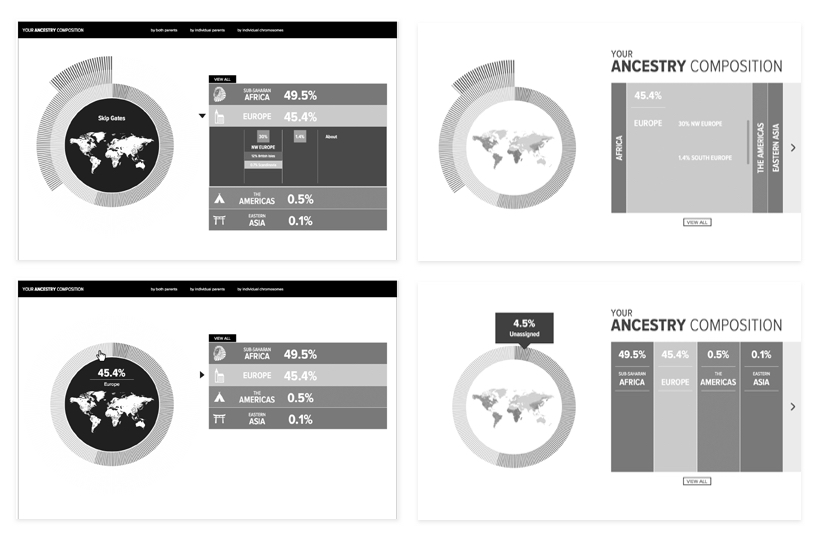
Ring charts on their own would not be the easiest thing to digest – especially a tiered one. A table view would be absolutely necessary to help the user see the detailed breakdown. I experimented with accordion-style tables both vertically and horizontally. In the end, I felt it was best to show as much of the data as possible without too much clicking or scrolling so I minimized a lot of the padding for each row.
Final designs
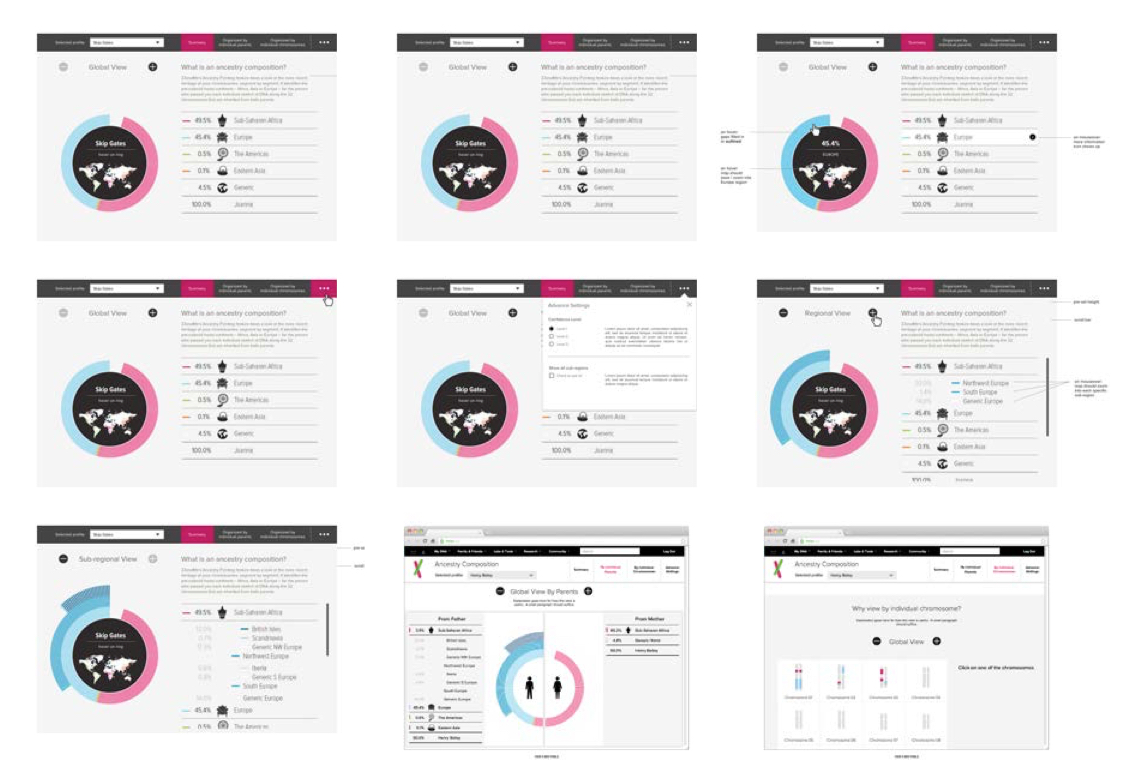
Final designs also showed a “Split View” for customers whose parents have been genotyped – so they can see what ancestries they inherited from each parent. There would also be the traditional “Chromosome View” so customers can see exactlywhich chromosome has what ancestry.